earned value management
The topics covered in this tutorial are directly related to those required by so-called “Earned Value Management.” This section will briefly introduce the earned value technique and provide two critiques of this method that explain why this technique is not more fully covered in this tutorial. If there is sufficient demand from users, later editions of this tutorial may include full sections on Earned Value Management techniques.
In the earned value method the activities in a Critical Path Method schedule are “loaded” with budgeted cost, actual expended costs, and value of the work as bid to the owner. As the project progresses differences between budgeted and actual costs may be quantified and used to project the expected cost performance of projects.
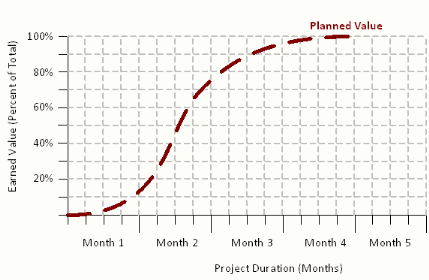
Earned Value Management is primarily a cost control tool that can be easily explained using the series of diagrams shown below. The x-axis of the Earned Value chart provides the duration of the project (from the start to the end of the project. The y-axis of the Earned Value chart shows the total percent of the project that is expected to earn for the given month. Most jobs, including construction projects, earn little during the first and last quarters of the project. The majority of billable effort occurs during the middle half of the job. The figure below contains an example of the planned value to be achieved for a hypothetical project. The Planned Value, shown in a dashed line, shows the characteristic “S-Curve” of a typical project.

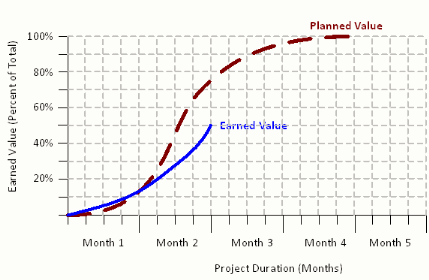
As the project begins, the value of the work performed is billed to the owner. These payments are shown on the chart as “Earned Value”. Since it is the unusual project that follows it’s original plan the line showing the “Earned Value” rarely matches the original plan. In the chart below the earned value is plotted as the solid line.

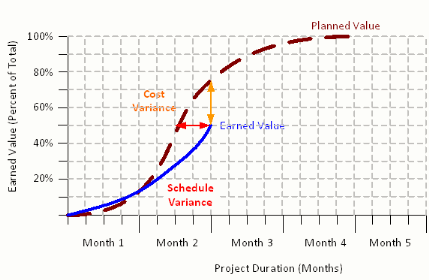
The objective of Earned Value management is to measure past performance against the planned cost and time goals. The Cost Variance is measured between the Earned Value and the Planned Value. In the figure below the Cost Variance arrow, shown in orange, demonstrates a project that is behind schedule, with respect to earnings. The schedule variance shows that the project has expended more duration than would have been expected for the current Earned Value.

A significant amount of mathematics, policy, and procedure has surrounds the use of Earned Value methods to predict the expected outcome of a project, based on it’s past performance. The blind use of these techniques will yield incorrect results due to (1) the expectation that future performance is not effected by past future variation in productivity rates, and that (2) only delays along the certain “critical” activities result in delays to the overall project. Users of the Earned Value Method will gain a significant insight into their required reports and projections by completing this entire tutorial.