total float notation & calculation
The third part of schedule calculation using the Critical Path Method is the calculation of the Total Float.Float is the amount of time that the activity’s path may be delayed without delaying the overall project. The diagram below shows where float is placed on the precedence diagram.

To calculate the total float for a Precedence Diagram, subtract the Early Finish Time from the Late Finish Time.

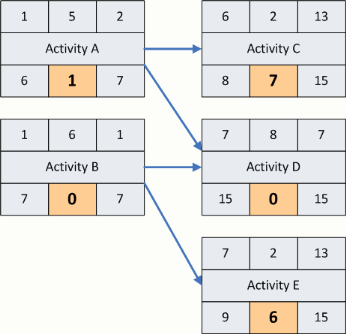
Once this is accomplished for every activity, then the float calculation portion of the schedule is complete. The diagram below show the location for the total float and provide an example of a small schedule with completed total float calculation.

an example diagram that includes total float for a slightly more complex sequence of activities is shown below. You may notice that the path of activities with the least float (i.e. zero float) is Activity B and Activity D. These two activities are on the critical path for this small project.

Typically the Late Finish Time for the last activity will be set to the project completion date. If the float is positive then the critical path may be delayed without running the project past the completion date. If the float is equal to zero, then any delay to the critical path will result in a delay to the project. Negative float identifies a critical path that is behind schedule.