total float calculation
In this page we describe the third part of arrow diagram calculations, the "float" calculations. The objective of the Forward Pass and Backward Pass is to allow the float to be calculated. In this tutorial we will be discussing only the Total Float. Sometimes you may see the term slack used in the place of float.
Total Float is the time an activity may be delayed without impacting the overall project completion time. Lets look at a Fenced Bar Chart example, below, to see the graphic presentation of Total Float. In the figure below the earliest the overall project can finish is the middle of June. You can see this by looking at Activity 4. Notice that Activity 4 depends on Activity 2.
A delay of to Activity 2 as the result of also delaying Activity 4. A delay to either Activity delays the planned completion for the whole project.
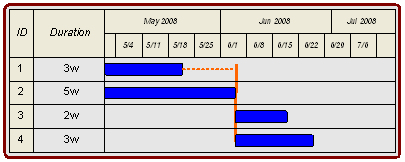
When a delay to an activity impacts the time when the overall project is complete, this set of activities is identified as the critical path. A more formal definition of the critical path will be provided a bit later.
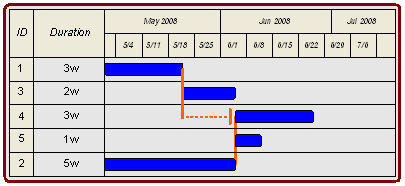
Here's another Fenced Bar Chart example. You may recall this example from the Fenced Bar Chart page. Notice that the activties are listed in order 1, 2, 4, 5, 2 to ensure that the graphical layout of the fences is clear. In this example Activity 2 and Activity 4 are again on the critical path.
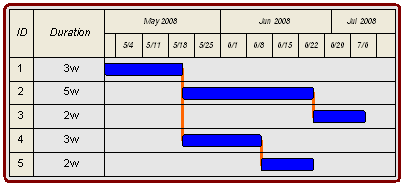
One final example using Fenced Bar Charts. Look at Activity 5 in the figure below. Activity 5 is shown to finish the week of 22-Jun-2008. Since the overall project will not complete until two weeks later, you can see that we can delay the start, or extend the duration of Activity 5 up to an additional two weeks without delaying the overall project.
To demonstrate that Total Float is a property of a path of activities, and not just a single activity consider Activity 4 and Activity 5. A total delay of two weeks could be experienced by any combination of delays in these two activities. If, however, the combined delays exceed two weeks, then the entire project will be delayed and the critical path would move from Activity 1, Activity 2, and Activity 3 to Activity 1, Activity 4, and Activity 5.
The amount of time you can delay an activity (either through late start or increased actual duration) without impacting the overall completion of the project is the total float
Okay, now back to the arrow diagram. In the arrow diagram the total float for each activity is the Late Event Time minus sum of the Early Event Time plus the Activity's duration. What we are looking for is the difference between the earliest the activity can finish and the latest the activity can finish.
Note that dummy activities also have float. Since the duration, by definition, of dummy activities is zero (0), you will be able to use the formula above to calculate the total float on the dummy activities.
Use the Arrow Diagram total float formula to calculate the total float for each of the activities in the network below.
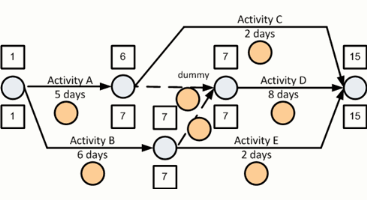
One question for you to consider is why won't total float for an activity on an arrow diagram simply be the Late Event Time minus the Early Even Time at the end of an activity?
A more formal definition of a critical path is that set of sharing the following characteristics (1) all activities in the critical path sharing the minimum float in the schedule and (2) the activities share a logical sequence from the start to the end of the project.
There are several practical issues that should also be noted regarding the critical path. First, there may be multiple critical paths in large networks. Second, if there are milstone dates placed in the middle of the network the activities in the critical path may not share the same minimum total float.